After the recent Mass Shooting in Thousand Oaks, California, together with some colleagues we were discussion potential reasons for these outbreaks of violence in the US. We had a look at the Wikipedia list on Mass Shootings in 2018. We were shocked to see that there as many as 106 shootings noted. On abc15.com, we found a map illustrating the location of every mass shooting in 2018:
It becomes immediately apparent that most of the shootings happened in the Eastern part of the US. Given that there is already structure in the data, we were wondering whether there is more.
For example, is unemployment one reason for the shooting? Or population density? Concretely, the question arose whether the number of casualties can be predicted by such information. I expected that the number of casualties would increase, the larger the size of the population, the larger the population growth and the larger unemployment.
Methods
On the basis of the Wikipedia list on Mass Shootings in 2018, I collected information about the city/town/village the mass shooting occurred. The lists contains information on 106 mass shootings. I used Wikipedia, because it allowed me to obtain easily additional information on the locality of the mass shooting by following the links on the page. I collected the following pieces of information:
- Population of the locality (city) in 2010 and 2016 (as provided by Wikipedia)
- Population of the state in 2010 and 2016
- Unemployment rate of the state
The 2010 data was based on the 2010 United States Census. I would have wanted to have information on the Unemployment rate of the locality. However, this surpassed my abilities. I also calculated the percentage of growth in population size between 2010 and 2016 for both, locality and state. In total, I used five variables to predict the the number of casualties (NumberOfCasualties).
- PopulationCity (in 2016, ranging from 3365 to 8622698)
- PopulationState (in 2016, ranging from 601723 to 37253956 )
- PopulationGrowthCity (between 2010 and 2016, ranging from 0.875 to 1.315)
- PopulationGrowthState (between 2010 and 2016, ranging from 0.994 to 1.35)
- UnemploymentRateState (in 2016)
For 9 of the localities, population size was available only for 2016. Those were excluded from the analysis. In pilot analyses, the inclusion of those 9 localities did not change the overall results of the present analysis. The shootings in the Bronx and in Brooklyn were tagged as shootings in New York City.
All of those pieces information were collected automatically from Wikipedia and a data tables using a custom-made script in R. The download of the html-pages was performed with the function getURL() from the RCurl package.
Analysis and Results
City population size in 2016 had to be log transformed in order to obtain normal distribution. All predictors were centered and scaled for analysis (z-scaled). I first performed a standard Spearman-Rank correlation analysis between the predictors. I want to highlight here two results:
- PopulationGrowthState and PopulationGrowthCity were strongly correlated (R = 0.56). This is not surprising at all, as the state population depends on the city population.
- PopulationGrowthState was negatively correlated with UnemploymentRateState (R= – 0.48). The same effect, weaker, was for PopulationGrowthCity (R=-0.32). This means that when the population size grew, the unemployment rate went down. While this might not be nothing new for people working in demographics and economics, this surprised me, as I would have expected these two variables to be positively correlated. I would like to see, whether this was observed on a larger scale.
NumberOfCasualties ranged between 0 (N = 40) and 17 (N = 1).
I fit a generalized linear model to predict the NumberOfCasualties (function glm, family = poisson). The analysis is quite trick, because of the high collinearity in the data, i.e. some predictor can be used to predict another predictor. This becomes apparent above. This is why I used a step-by-step inclusion procedure and checked for indicators of collinearity in the model. If you want to read more about how to address collinearity in regression analyses, together with two other colleagues I have published a paper here. I have not tested any interactions between the predictors because of the small sample number in the data.
As it turned out, UnemploymentRateState and PopulationGrowthState were not significantly predictive for NumberOfCasualties (this means that the effect they cause cannot be used to support our initial hypothesis). I found this surprising, as I indeed would have predicted that unemployment drives people to commit horrible things.
The three remaining predictors were significant. The model’s intercept was 0.271 (std = 0.09, z = 2.9, p = 0.003). This is the estimated logit, where 0 equals 50% (in R, you can transform those values back using the function inv.logit() from the boot package. I did not apply this because it changes the visualization)
- PopulationState (estimate = 0.2, std = 0.07, z = 2.9, p = 0.004)
- PopulationCity (estimate = -0.4, std = 0.08, z = -4.8, p < 0.001)
- PopulationGrowthCity (estimate = 0.3, std = 0.07, z = 4.4, p < 0.001)
The effects are illustrated in the following figure (illustrated with the function visreg() from the package visreg. I restricted the y-axis which is why not all data points are illustrated). The y-axis represents partial effect of the estimated logit, i.e. how the intercept (logit 0.271 = probability of 0.57 that a large number of people are killed) has to be changed depending on the predictor. 0 therefore represents no change (horizontal gray dashed line), -2 means that the intercept has to lowered to logit -1.729 = 0.15 probability; +2 means that the intercept has to be increased to logit 2.271 = 0.90 probability of a high number of casualties.
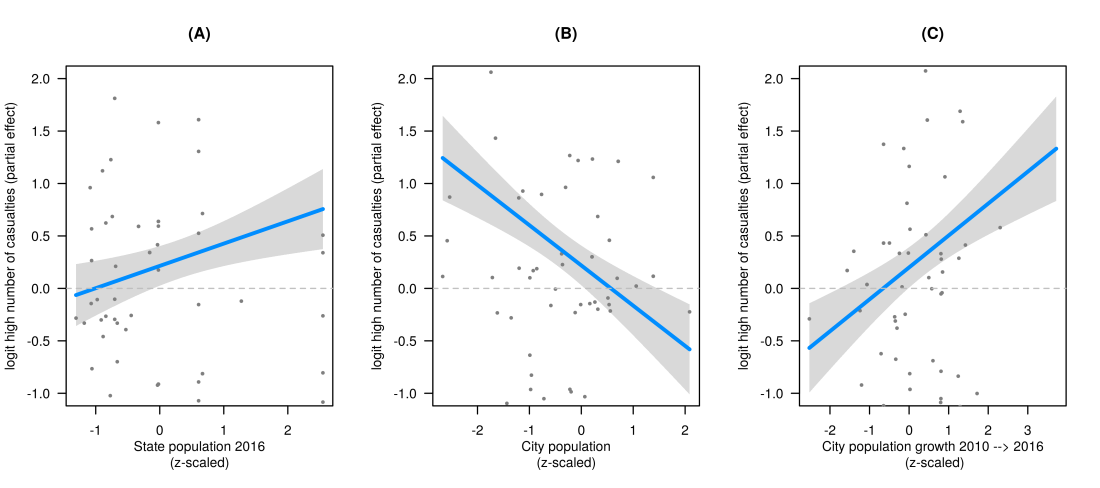
Panel (A) represents the population size of the state the mass shooting occurred. The larger the state, the larger the probability of a high number of casualties. This supports my hypothesis. Surprisingly and contrary to my hypothesis, the effect is reversed for the population size of the village/town/city where the shooting occurred: the smaller the city, the larger the probability of a higher number of casualties; the larger the city, the smaller the probability of a high number of casualties. Finally, the probability of a high number of casualties increases, when the city population has strongly grown between 2010 and 2016. This makes sense as: when cities grow, the total state population increases.
I will avoid any further interpretation of the data and the analysis. I also have not included other, potentially very interesting, variables into this analysis, in order to keep things as simple as possible.

Interesting to see how a linguist spends his Sunday afternoons! Thought-provoking analysis. It occurs to me that you’re missing a very important factor which I think is highly likely to be influencing the greater number of shootings on the East Coast. I’ll call it life-style. Having lived extensively on both coasts, there is a huge difference in the speed of life and the level of stress between places like, say, New York and California. Now you might ask, how would we quantify that? I could see incorporating data such as number sick days people take each year and/or number of people in mental institutions and/or length (distance) that people commute each day and/or …. I hypothesize that you might find correlations between greater numbers of mass shootings with higher numbers of sick days, and/or more people in mental institutions (or maybe jails), and/or longer commutes, all of which create a fast-paced/high-stress environment and simply makes people “go crazy”.
LikeLike