I am a trained general linguist, turned into a psycho-linguist, and currently, I am using neural networks to investigate human cognition. Some how amidst all these computational methods, I found out about sentiment analysis. Sentiment analysis allows a data scientist to assess whether a sentence, a paragraph in a text such as a book, an sms or even a twitter post expresses overall positive, negative or neutral feelings. So, I thought, I’ll give it a try and take a first dive into social media analysis (I understand that students of computational linguistics learn this in their third semester, but again, I am a psycho-linguist ;-)).
The data
A colleague of mine provided me with a data set of German tweets he collected between November 2019 and January 2023 for his own research. He collected them irregularly, but managed to collect tweets for 27 months, which amounts to an estimated 850 million tweets.
Target of the analysis
I was thinking about what exactly I could analyze. Given that I live in Germany, the most obvious thing to do would be to perform a sentiment analysis of tweets that contain, you guessed it, the names of car manufacturers. I understand that there are different kinds of tweets ranging between salesmen advertizing their merchandise, radio stations warning about crazy drivers up to people actually expressing their opinions. With the analysis, I wanted to get something like an overview of what is the general sentiment about car manufacturers, and how it differs between manufacturers and whether they are changes across time.
The question arises, what manufacturers to investigate. I thought going for the most frequent car manufacturers in Germany, at least those that I am aware off and that I see more or less every day on the streets in my region. The manufacturers I decided to investigate are: Audi, BMW, Citroen, Fiat, Ford, Lada, Mazda, Mercedes (also represented as Benz and Daimler), Mitsubishi, Peugeot, Porsche, Renault, Skoda, Subaru, Tesla, Toyota, Volvo, VW. (In hindsight, I forgot Opel, Kia, Seat, Hyundai, Honda and many more. But you know, you have to make some cut-offs sometimes. Nevertheless, I think I have a good overview).
Sentiment analysis — Hypothesis
Now is the time to hypothesize what we might actually find out. My general feeling is that Germans are very fond of their own cars. Accordingly, I expected German manufacturers to get overall more positive tweets than negative tweets in contrast to foreign car manufacturers. So this is the general hypothesis zero here in this exploratorive analysis.
Processing
As the tweets were stored in a JSON format, I wrote a Python script to process the tweets. I read in the tweets from each month and searched iteratively for the manufacturers names, extracted the respective names and performed the sentiment analysis. All text was processed in minor cases.
There were some minor problems. “Benz” yielded significantly more tweets than the other manufacturers. As it turned out, the sequence “benz” can be located within words like “Nebenzimmer”. Can you spot it? “neBENZimmer”. The same problem was with “Ford”. This sequence of letters can be part of many German words, such as “auffordern” (aufFORDern). To avoid such problems, I specified that the names should be located within white spaces (apart from Mercedes, which can be part of Mercedes-Ben). In this way, I aimed to exclude tweets that contained words which contained the manufacturers name.
As it turned out, the extraction would fail for BMW and VW, i.e. I have not obtained any tweets for these two manufacturers. It is possible they failed because the number of tweets was too high to be processed. However, since I got enough data for the other two manufacturers, I postponed a deep investigation of why this was the case. If you would like to have a look at the scripts I used, you can download them here from OSF: https://osf.io/6ej7z/.
The sentiment analysis was performed by means of the Python-Package “German Sentiment Classification with Bert”, which can be downloaded from here: https://huggingface.co/oliverguhr/german-sentiment-bert. The package was trained on 1.8 million samples like Twitter, Facebook, movie, app and hotel reviews. The sentiment classifier classifies a text as positive, neutral and negative, and provides certainty scores measured in percentages for this classification. In this analysis here, I will focus purely on the discrete classification.
I tested the classifier on obviously positive and negative sentences and was surprised to find out that it worked like a charm. It produced one surprise, though. When it had to process the sentence “Du bist mein Sonnenschein” (You are my sunshine) which is clearly positive in German, it classified it as “negative”. I believe this to result from the biases in the training set: Hotel guests typically are annoyed when there is no “Sonnenschein” during their stay and give bad ratings.
Inspection of the data
In total, I extracted 1,030,445 tweets for sentiment analysis. I perform here a purely qualitative analysis using the statistical software R. Plots are visualized using ggplot2.
Before we can test our hypothesis, we need to crunch some numbers in order to understand our data. Specifically, what is the distribution of tweets per manufacturer and how does the distribution vary across the months. The figure nicely illustrates that Merceds, Porsche and Tesla yield the most tweets in the period of investigation while manufacturers like Citroen, Lada and Subaru yield the smallest number of tweets. Clearly, we got a highly skewed distribution.

My first assumption was that this distribution should also correlate with the number of registered cars in Germany. So I collected this information from the Kraftfahrt-Bundesamt for January 2022. And indeed, there was medium correlation of 0.33 between the number of collected tweets for each manufacturer and the number of registered cars in Germany.
Another inspection of interest here is how the number of tweets developed across time. I am going to demonstrate this by means of three manunfacturers: Mercedes and Fiat:


As you can see above, the number of tweets across time oscillated for Mercedes. But overall, it remained relatively stable, if compared to the number of tweets across time for Fiat. Can you spot the odd one out? Exactly, for the timestamp 202109, i.e. September 2021, there is a spike in the number of tweets. It turned out that this spike was present not only for Fiat, but also for Skoda, Renault, Citroen, Mazda, Mitsubishi, Peugeot, Subaru, Toyota and Volvo. Here’s another example:

Something similar also happens for Porsche, but in 2023:

This one spikes through the roof. It could be that this spikes are due to a wrong identification of manufacturers in tweets. However, I checked manually and these tweets indeedn still contained the manufacturer names.
I therefore could not help but wonder what might have caused this sudden rise in number of tweets, especially in 2021. I there googled “Events 2021 September Automotive” (ignoring the incident for Porsche), and one thing that I came across was that in September 2021, there was the German election. And it seems that the automotive sector was very aware of this election as demonstrated by this article published by Reuters (no surprise there, of course it was in a car-heavy country like Germany). I could have spend more time on these outliers, but I rather wanted to focuns on inspecting the sentiment ratings of the tweets. However, such outliers are the source for additional investigations.
Number of tweets per manufacturer
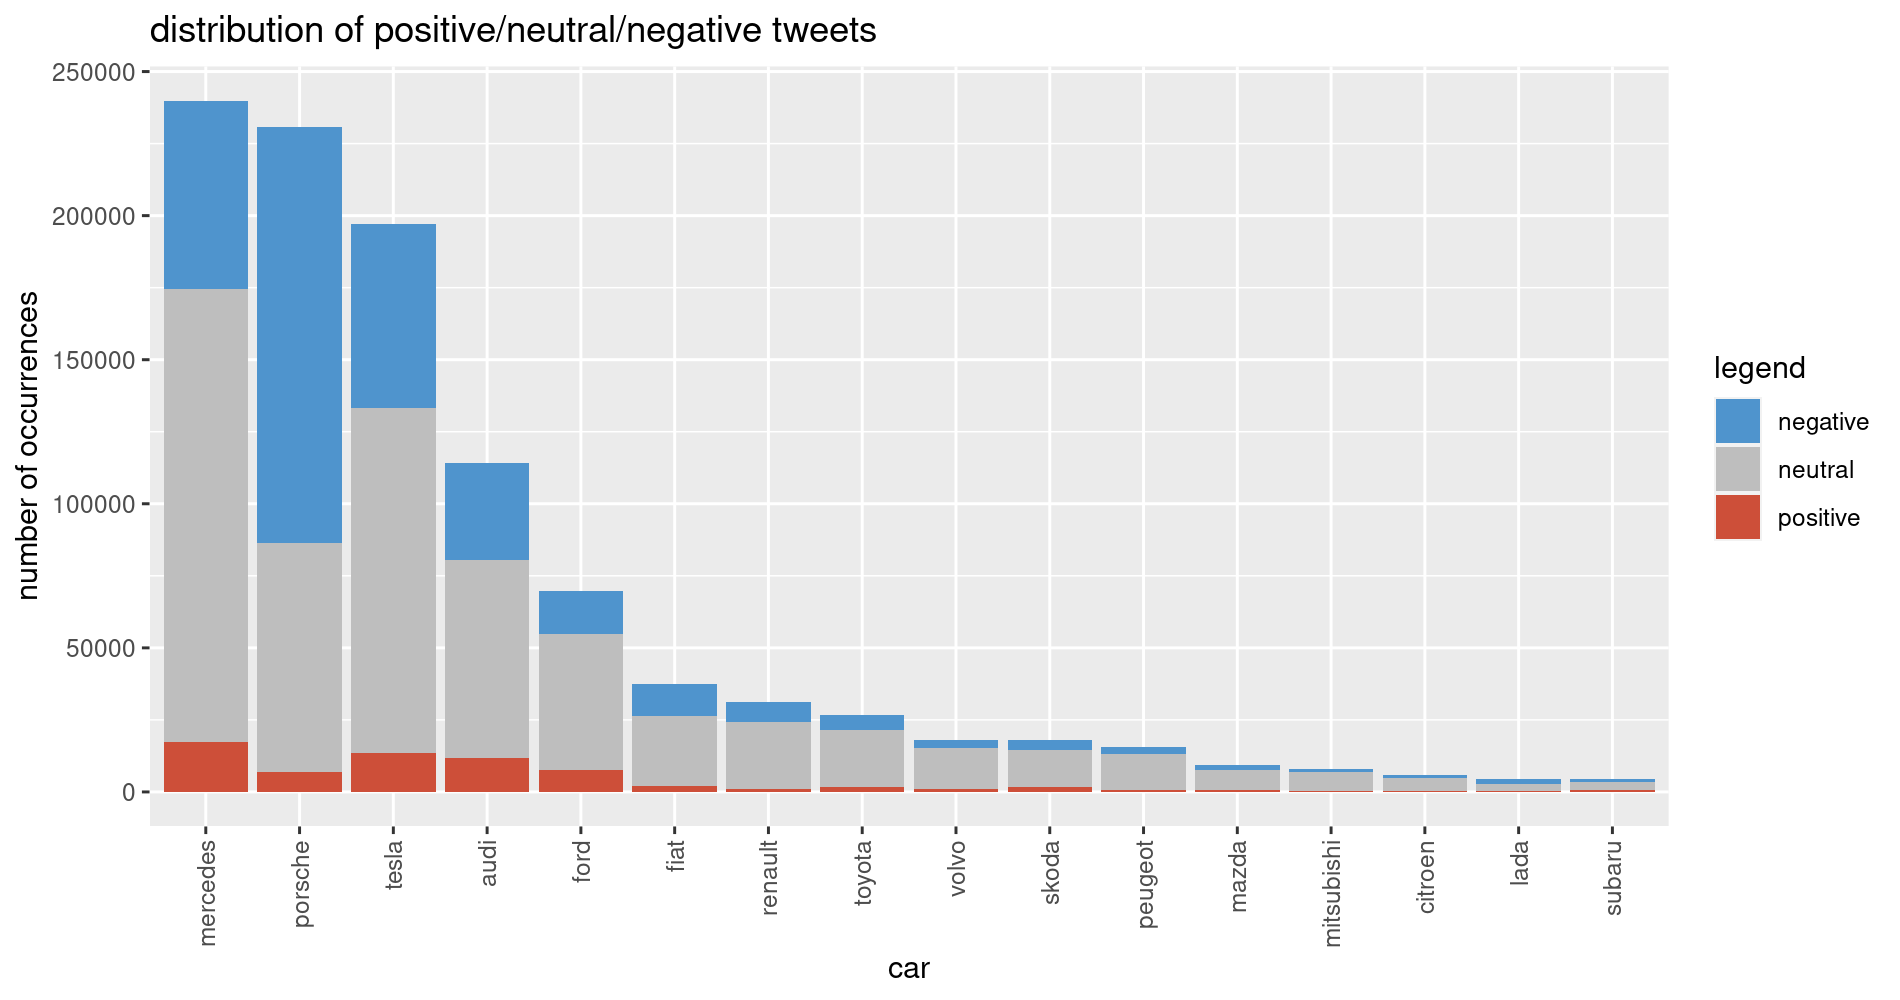
The above plot demonstrates the distribution of positive, neutral and negative tweets depending on the manufacturer, sorted depending on number of tweets. We can only interpret those columns which are most visible, i.e. Mercedes, Porsche and Tesla. Manufacturers get a lot of neutral, some positive and many negative tweets (the colleague who provided me with the Twitter data told me that in his experience, Twitter is a very negative environment). And one manufacturer stants out immediately: Porsche, as it seems that there are MANY negative tweets for this manufacturer.
Development of sentiment across time
Taking into account the spike in number of tweets, we first need to inspect how the number of positive and negative tweets developed across time (I will ignore the neutral tweets here). Here’s the development of tweets for Mercedes:


We could consider the spike in December 2021 (20212) to be extraordinary, given that the previous and following months had fewer negative tweets. However, now let’s see how this development looks like for Mazda (taking into account the spike in September 2021). Will there be a spike too?

Well… there is no spike of positive tweets in September 2021 (but notice that there is a bulge of positive twees across the entirty of 2021).
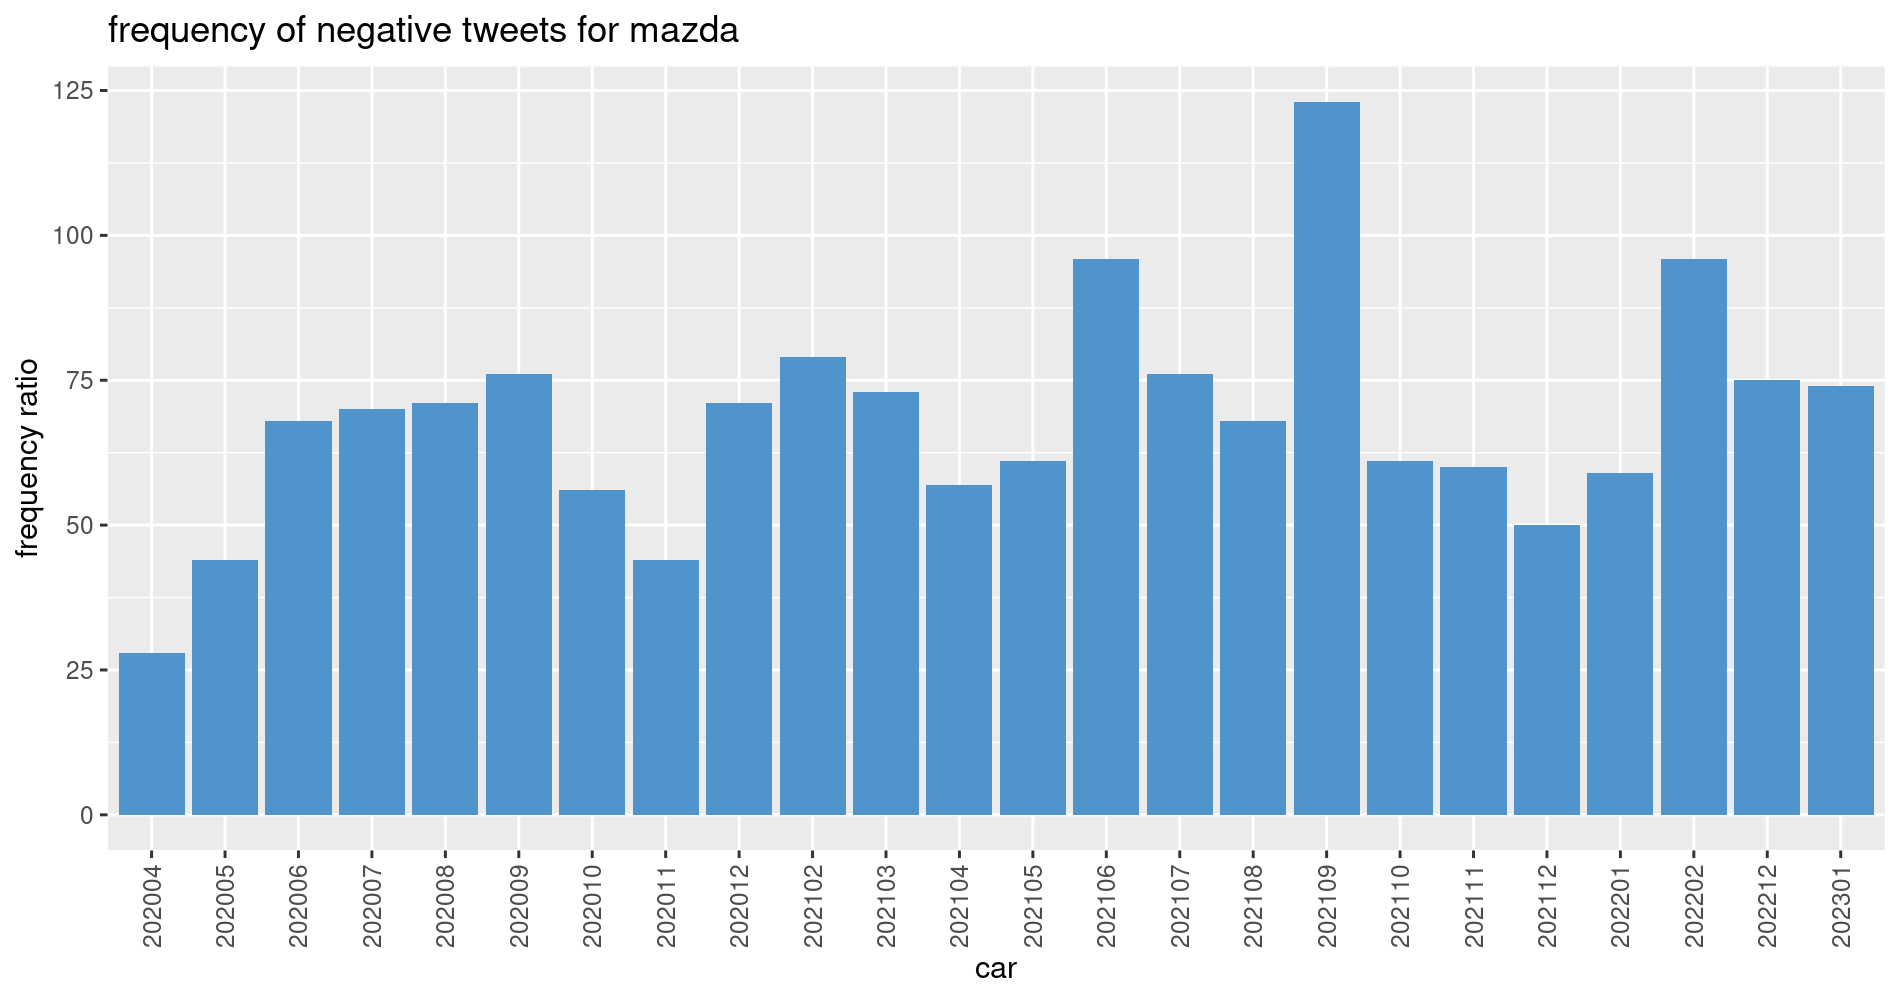
But it seems that there is a small spike of negative tweets in September 2021. This spike is not not very big. However, look at this one for Porsche:

Oh dear!!!! This spike definitively would entail an entire investigation. But for now, I just simply exclude it from further analysis (but I might get back to it at some point, so stay tuned). For now, I want to get back to the general topic of this post: how do car manufacturers differ in their sentiment on Twitter.
Comparison of sentiments per manufacturer
On the basis of the above inspection, I came to the following conclusions:
- First: In order to get a general assessment of sentiment of car manufacturers on Twitter, I need to exclude the months for which there are local spikes, as these spikes bias the data to negative classifications. Specifically, I excluded a month of tweets for a manufacturer when the number of tweets per month exceeded 2.5 standard deviations away from the mean number of tweets per month. Through this exclusion, we lost 246,943 tweets, i.e. roughly 24% of the data.
One might argue that this is a lot! However, this exclusion is warrented: the total number of months-by-manufacturer combinations is 384. The excluded tweets were part of only 13 months, i.e. 3.4%. In other words, 3.4% of the collected time points were responsible for 24% of the tweets. If they had stayed in the data set to be analyzed, they would exert an overly strong bias in the analysis.
- Second: Given that the number of tweets per manufacturer differ strongly, absolute numbers cannot be used to compare positive vs. negative tweets per manufacturer. Accordingly, I will calculate the RATIO between negative and positive. Given that there are more negative than positive tweets, I will calculate how much more negative tweets than positive tweets there are. I will call this measure the negative/positive ratio. Only in this way one can evaluate the sentiment on twitter.
The following figure illustrates the negative/positive ratio per manufacturer. Overall, the negative-to-positive tweets ratio varies between roughly 8 (i.e. eight times more negative tweets than positive) and smaller than 2. The further on the left, the smaller is the ratio; the further on the right, the larger is the ratio.

Recall that I hypothesized that German car manufacturers should obtain more positive tweets than other manufacturers (simply because of the nation’s fondness for their cars). However, the above plot demonstrates, that this is not the case. In detail, Renault has the highest negative/positive ratio among all inspected tweets. However, it is not that French cars get worse evaluated than other manufacturers. It is really only renault, as Citroen and Peugeot are in themiddle field. Ford has the lowest negative/positive ratio. In other words: people seem to be very satisfied with this manufacturer.
What’s more, Porsche and Mercedes, i.e. those manufacturers with the highest prestige in Germany, are among the higher ranked manufacturers: Mercedes is on rank 11 of 16 and Porsche on rank 13 of 16 (intersparsed by Lada, what an irony). Audi, on the other hand is on rank 7.
Conclusion
This analysis was my first dive into sentiment analysis of social media. I understand that the data at hand comes with many pitfalls. The colleague who provided me this data immediately responded, I should run a stance-detection in order to obtain a more fine-grained picture. Specifically, tweets that have been evaluated negatively might take a positive position towards a manufacturer. For example, the sentence “Nothing worked, everything is crappy, of course, it is not a Mercedes” would have been classified as negative, but has a positive stance towards Mercedes.
Another aspect to be taken into account is the certainty with which the sentiment classifier classifies a tweet as positive, neutral or negative. The present analysis was based on the discrete classification, but a more fine-grained analysis is indeed provided, when this gradient measure is taken into account. What is more, rather than doing simple counts, this measure allows to do detailled regression analyses. So stay tuned, there is more to come. One thing I want to do is to analyze the sentiment of Twitter post about the German health care system. Give that the posts have been collected during the Covid-19 pandemic, this should be a lot of fun!
